The
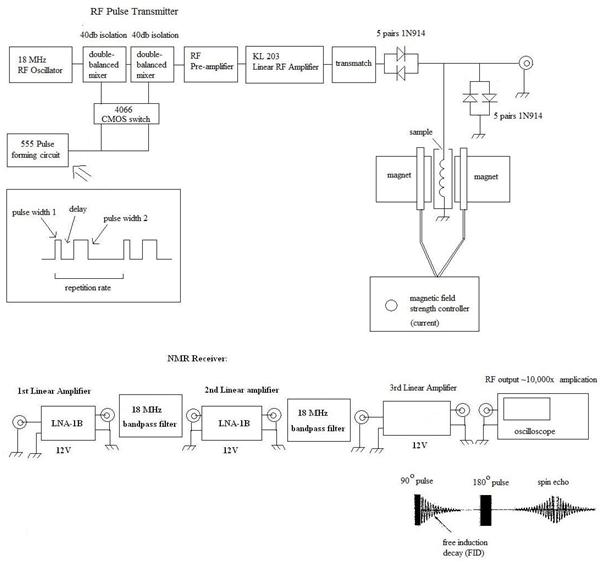
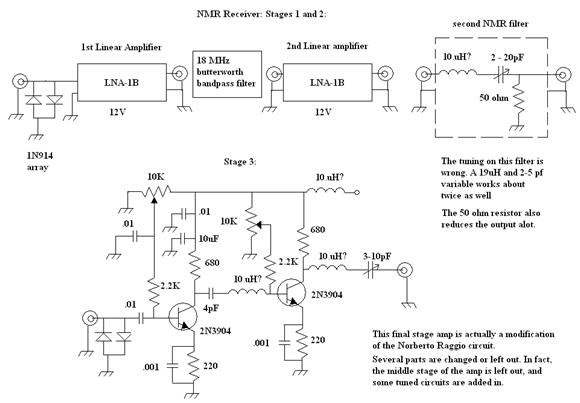
receiver has an input protection array of multiple pairs of 1N914
diodes. A LNA-1B linear amplifier was used for stage 1 and 2, from the
now defunct Erickson Engineering. The feature a broadband gain of about
25 db between 15 and 200 MHz. Oscillation
feedback between the stages was an issue, which was mitigated by the
use of impedance matching band-pass filters between each stage. The
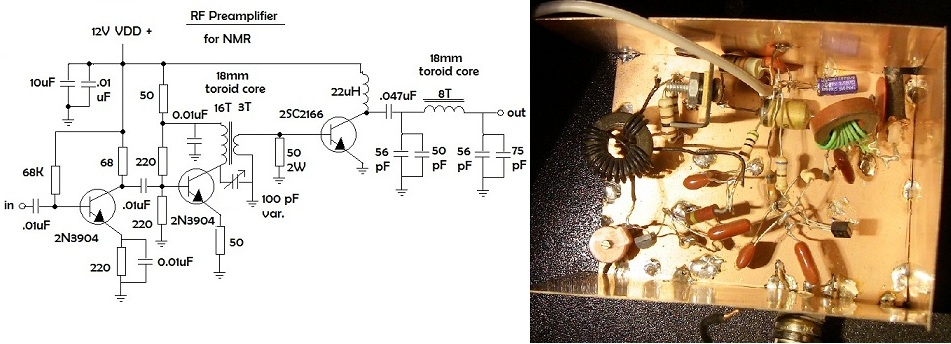
final amplifier is a modification of a circuit featured once on Norberto Raggio's website . I
included some tuned circuits in it to try to eliminate RFI, which is a
considerable problem in my neighbourhood.
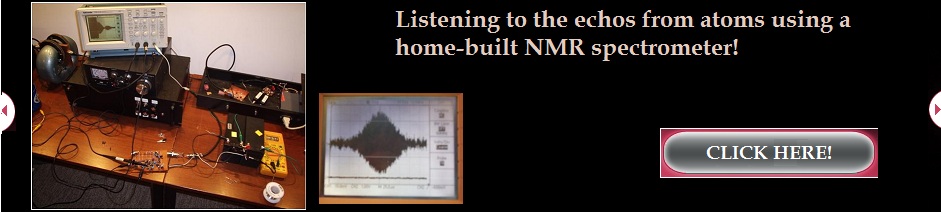
Experimental Results:
Here
are some examples of the FIDs and spin echo's I have generated on this
device. My principle interest was in this phenomenon, and less so on
the H proton spectra itself - spectra can be generated by converting
the output signal to DC and then performing a scan of the DC intensity
vs. magnetic field strength for a given pure compound.
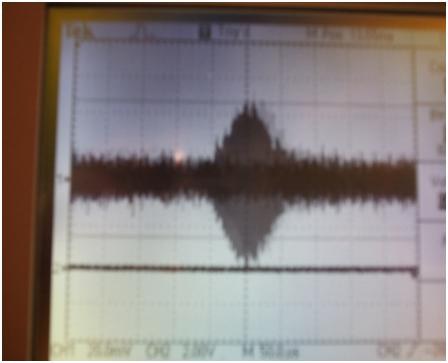
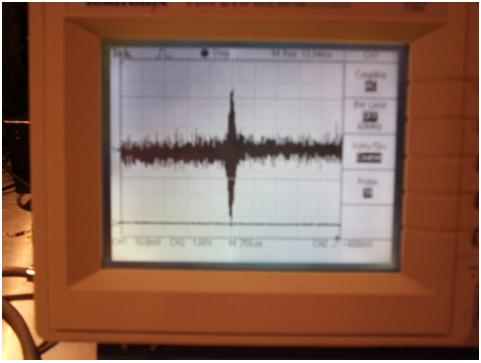
An
example FID signal from glycerol.
Signal intensity is about 700mV, the noise is about 20mV before pulse,
about 100mV after. S/N
is about 7:1 to 35: 1.

Spin-Echo:
this is somewhat weaker – S/N about 3:1 (signal about 70mV) (Glycerol):
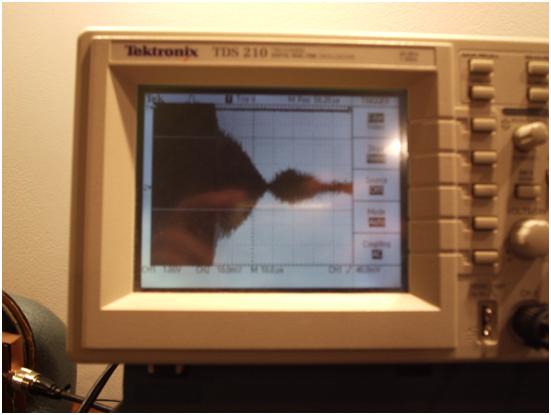
Spin
Echo shown 10mV resolution, 25uS per division, glycerol sample:
Spin
echo again, glycerol, 200uS per division:
Experiment with Tap
Water:
Tap water produced a FID and spin echo at about 100-200mV (S/N =
5-10:1). When a 90 degree pulse followed by a 90 degree pulse was used
(each 50uS long), a spin echo followed, followed by another weaker one
the same distance further on, and another one still, barely
discernable. Perhaps this is like the Carr-Purcell sequence.
Experiments with Teflon:
A piece of Teflon was rolled up and inserted into the coil, without a
test tube. The peak from Teflon Fluorine protons was about 100mV in
2004, about ½ that of glycerol. It had two visible peaks in intensity
with magnetic field strength. I attempted to view the spin echo, but
could not find it immediately, and then the magnet power supply
overheated. The Fluorine FID was found at around +1.82 amps in 2008.
The Fluorine FID could be seen at about 300mV with rolled up Teflon
inserted into the sample coil, but not with NaF as a solid or in
solution. It was also seen with PVDF powder in a sample tube, although
the signal was only at about 50mV with 25 mV noise. When the PVDF was
dissolved in acetone, it could no longer be seen. No spin echo's could
be found for Teflon or PVDF.
March, 2008 - Attempted
to improve the final stage receiver:
A simpler circuit was created for the final stage receiver using LMH
6609 operational amplifiers.
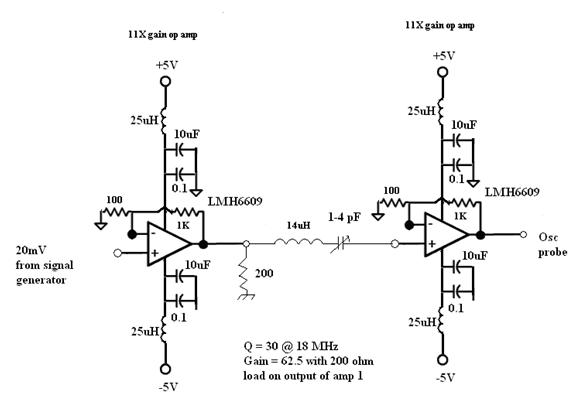
The load
resistor was introduced on the output of amp 1 to prevent oscillation.
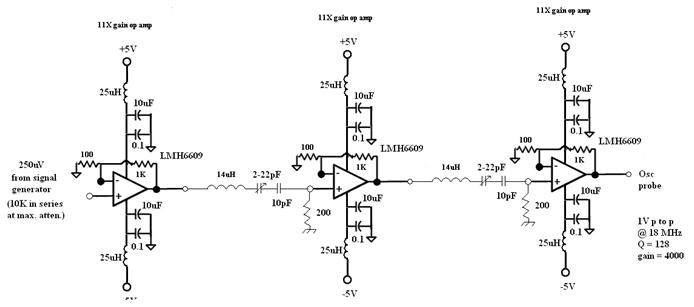
The Q of the series circuit was much higher in this configuration. With
a second filter stage (3 amps total) The gain was 4000x, and the Q was
128:
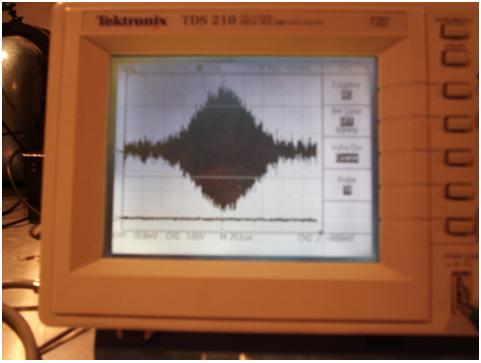
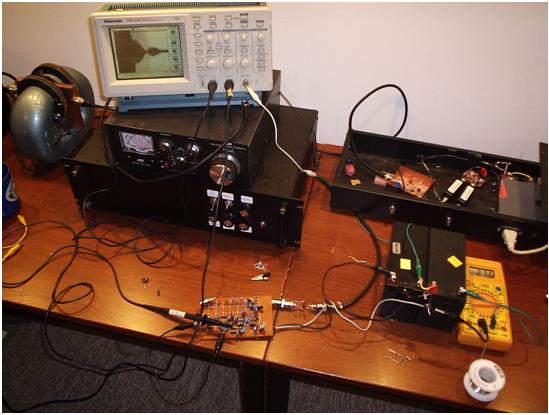
This above amplifier was then tested
alone in the NMR circuit, see picture below:
Closeup of the FID signal:
Video's
of this project can also be found on YouTube: http://www.youtube.com/user/plenum88 .